MapKit performance in SwiftUI
N.B.: Clustering in SwiftUI is only possible when using UIViewRepresentable, there is no native SwiftUI view to do it. See here.
I was given an interesting challenge, to inspect performance on an app that uses MapKit, to display certain points of interest. The app is called Handiplats, and it helps users from Sweden find parking spots for people with disabilites. It’s developed by my colleague Kristoffer Jälén.
What caught my eye, were UI freezes when zooming out of a particular region. The app displays a lot of annotations, about 7000, but various reports over the internet tell, that MapKit should be able to display them without a problem. So then, what could possibly be the issue?
At first, I suspected database access being slow, but that wasn’t the case. Even with all the annotations loaded in memory, map view would perform sluggishly. I tried various combinations of incantations, but to no avail. Desperate, I turned again to Apple’s own sample code on clustering. Curious, I thought. There is no sample code for clustering in SwiftUI, the sample app is written for UIKit, Apple’s original framework for developing user interfaces for the iPhone. That made me think. I rearranged the application to show the map view embedded in a normal UIViewController. And I couldn’t believe my eyes. Performance returned, buttery smooth animation when zooming out and clustering performing seamlessly, the way it was intended to.
I fired up instruments to see where the catch was. Interestingly, the SwiftUI version made a bunch of calls to add subviews to what I assume is the map layer. The UIKit version did not have that.
I do not have any inside knowledge of how MapKit or SwiftUI work internally, but this is an interesting case of where it would be preferable to use UIKit over SwiftUI still. Perhaps only until the next WWDC, who knows.
As part of the investigation, I wrote a small app that uses both UIKit and SwiftUI to show a map view with 10k annotations. Not surprisingly, the performance was similar. I made a few more instruments runs to confirm.
MKMapView embedded in a SwiftUI view will clog the main thread.
Comparing both runs, there is an interesting thing to observe.
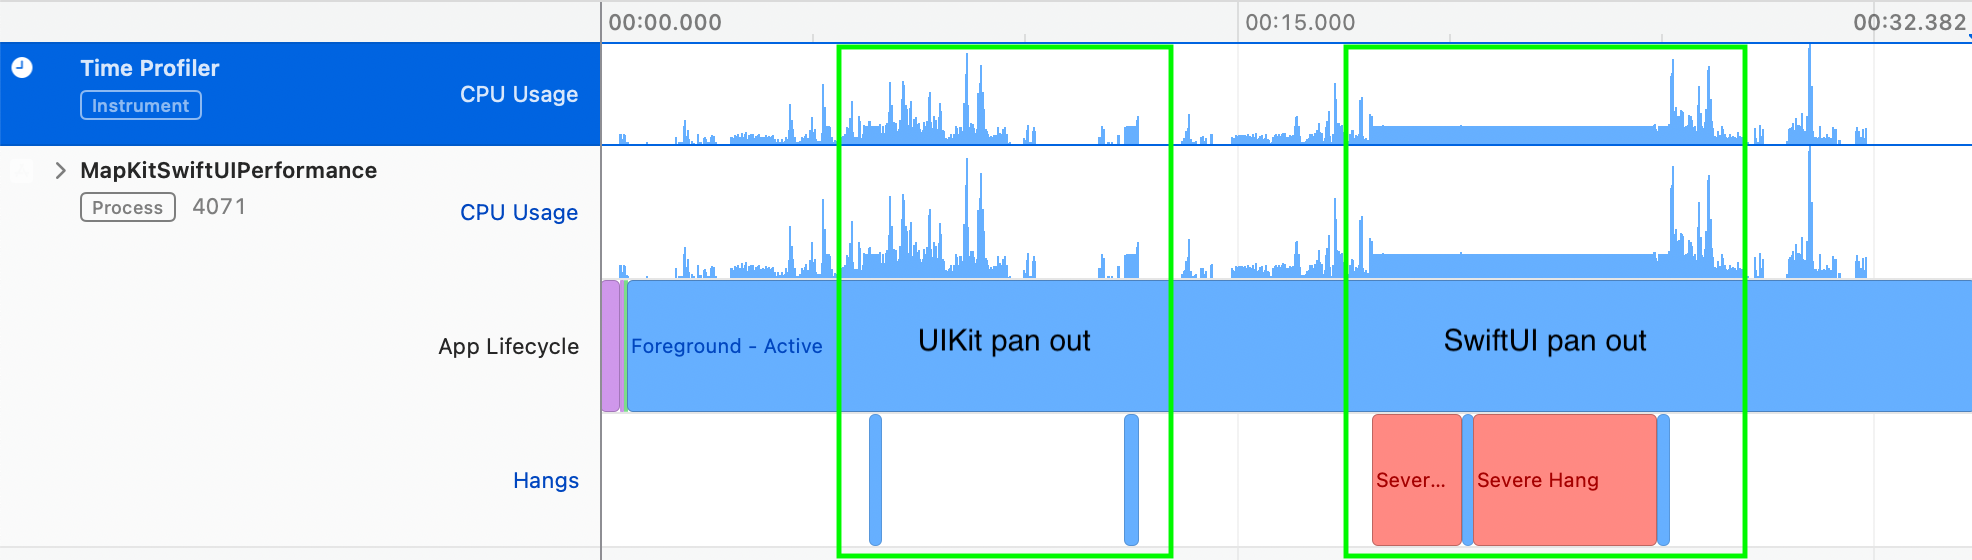 Instruments Time Profiler run with highlighted UIKit and SwiftUI runs
While SwiftUI code gets stuck adding annotation views, nothing of the sort is present in UIKit backed code. What might also be interesting is that SwiftUI stack trace shows signs of a gesture recognizer being used.
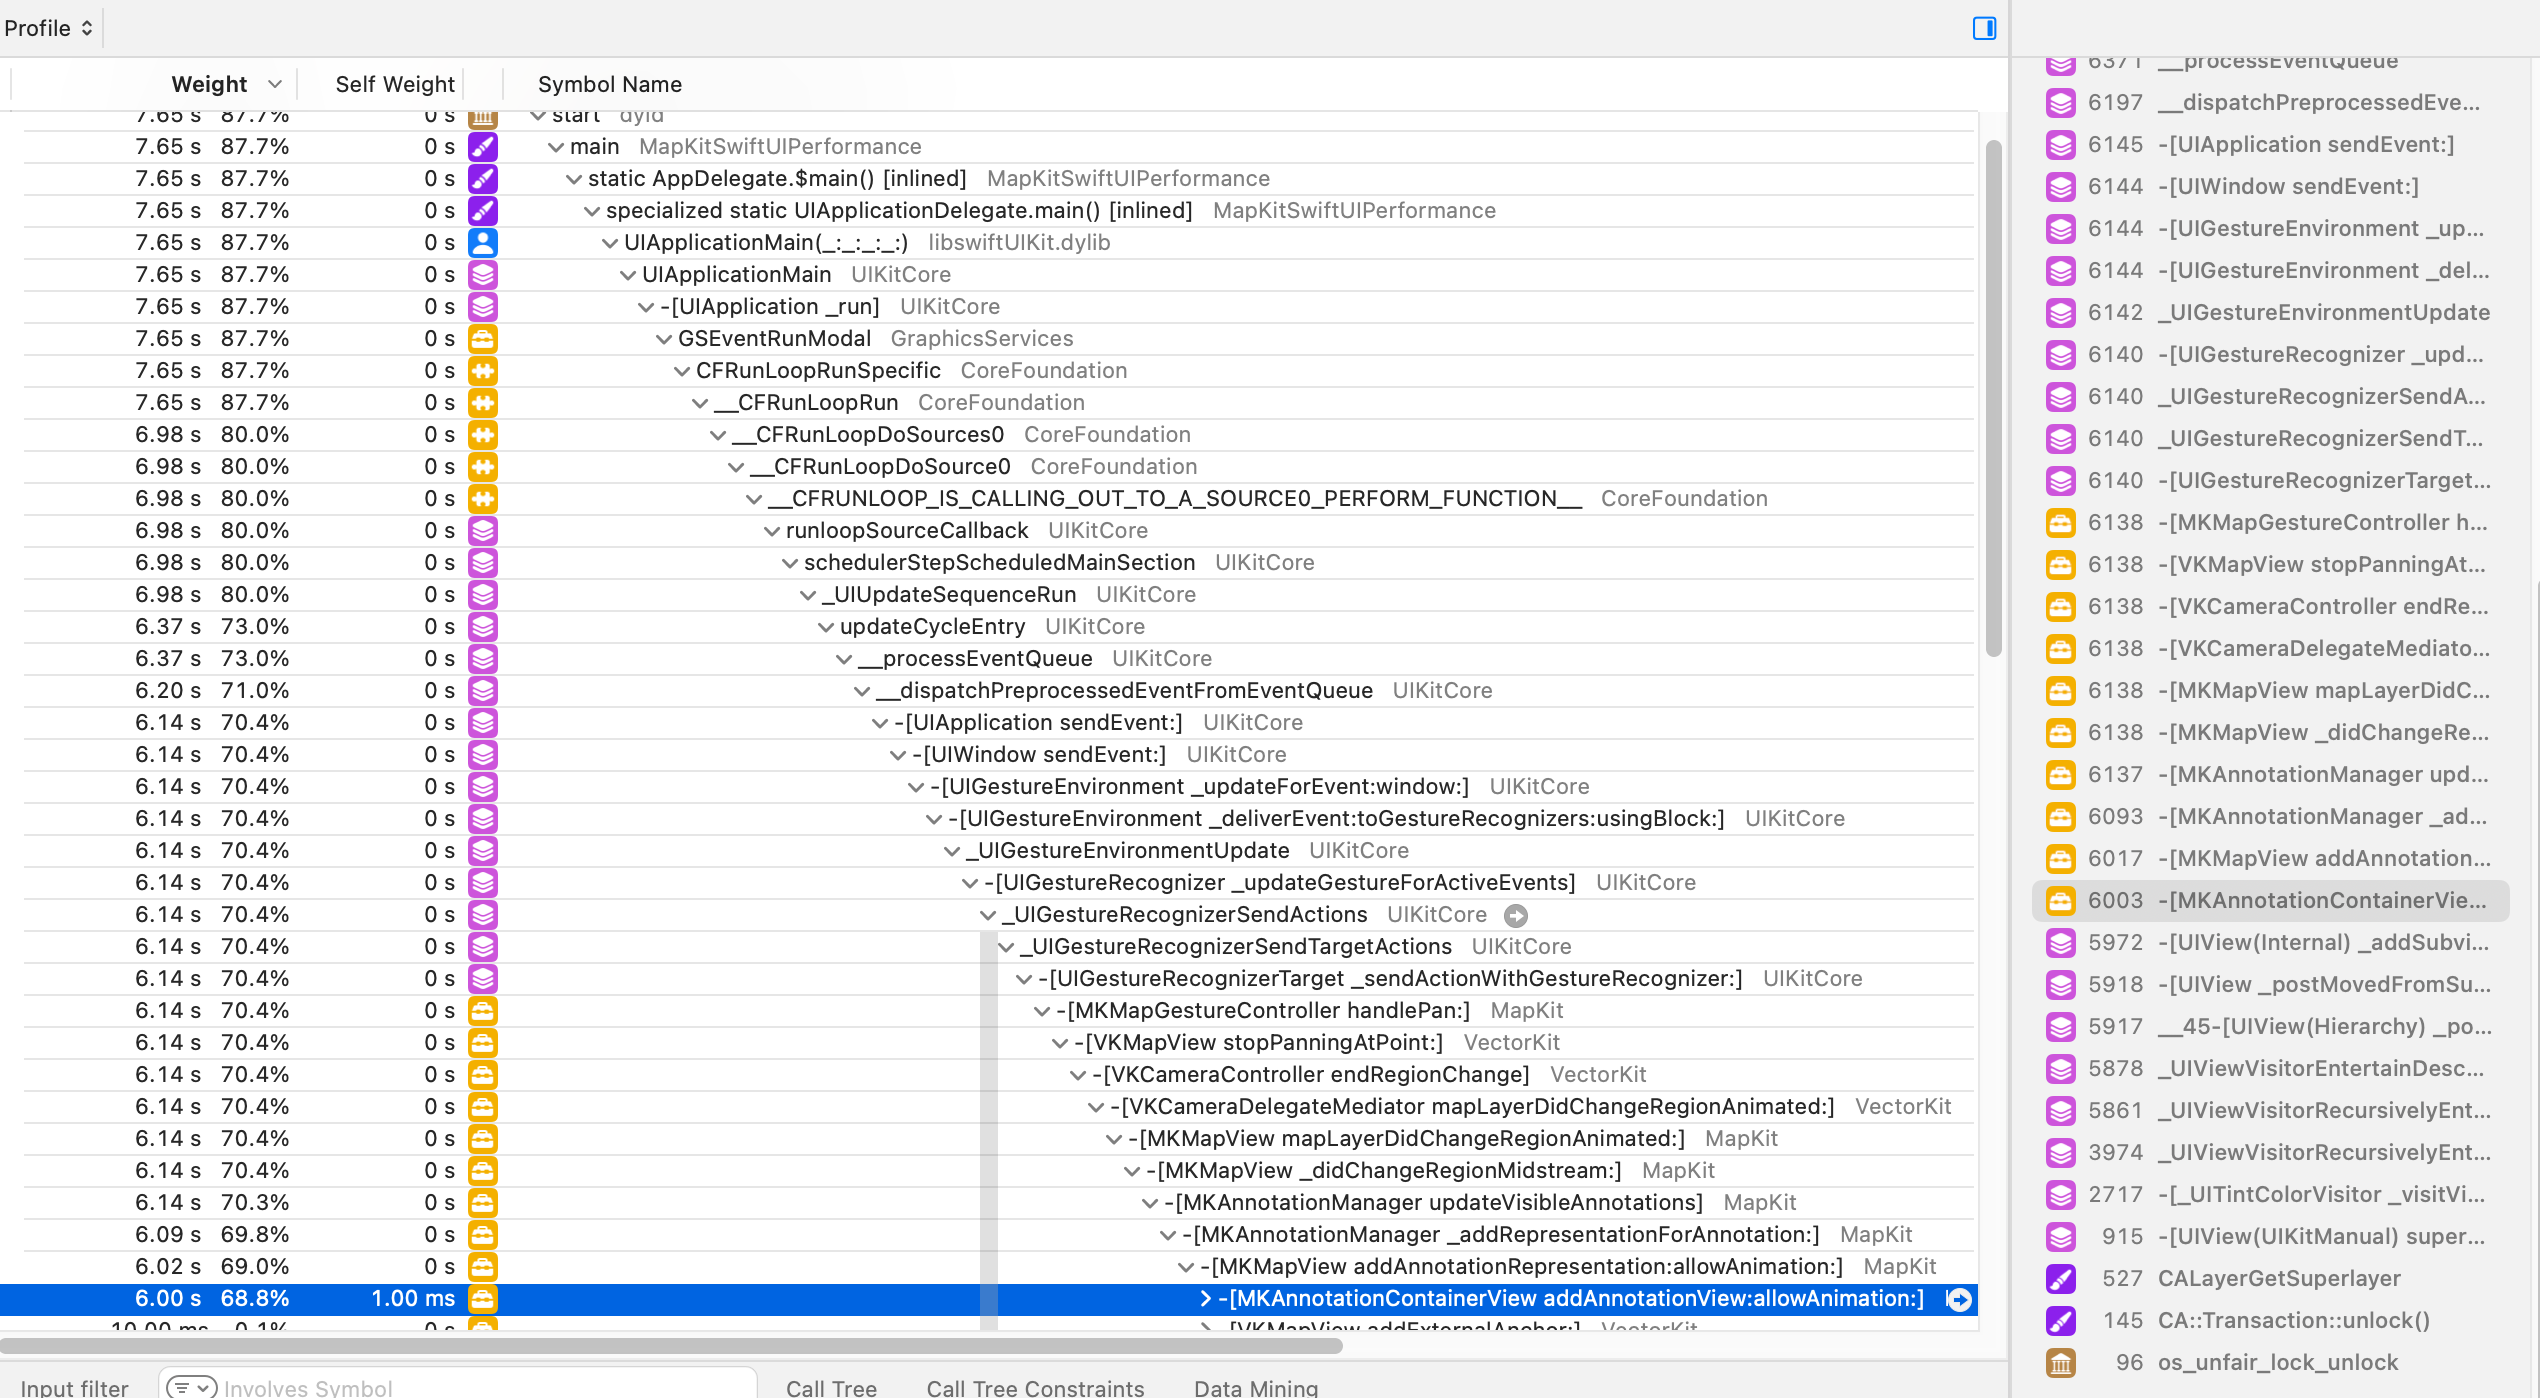 SwiftUI Spending a lot of time adding annotation views
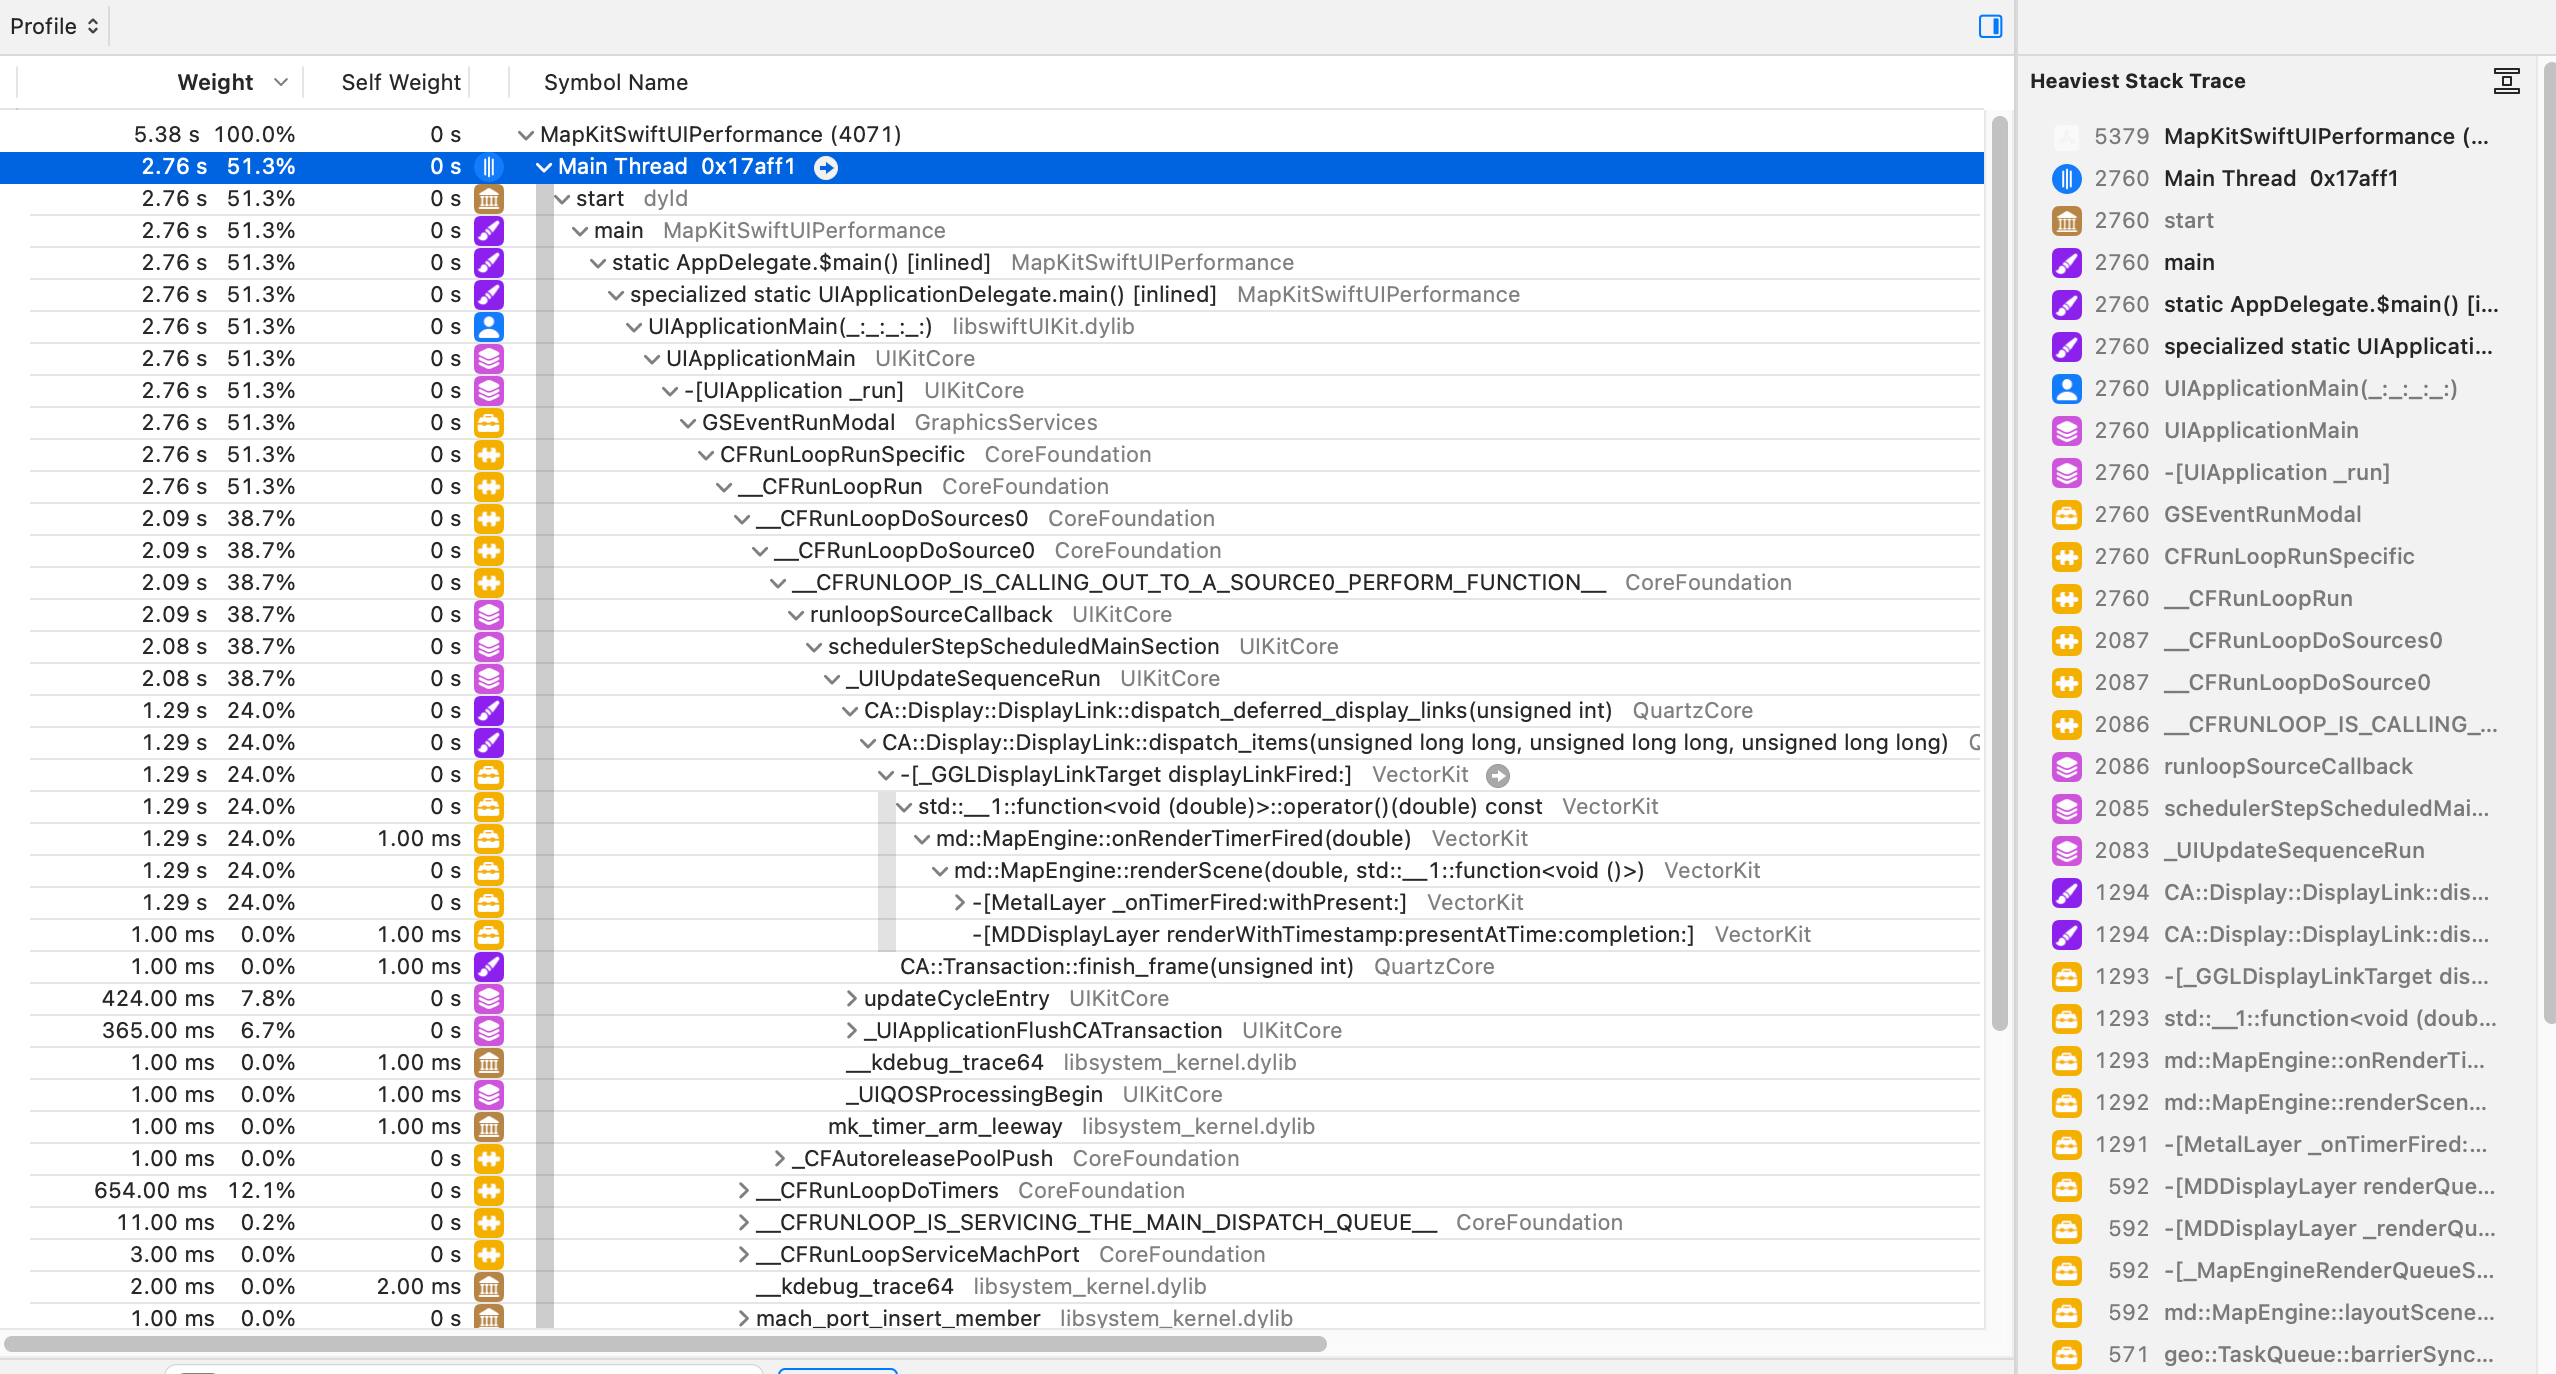 UIKit happily chugging along rendering stuff with Metal
In the end, Kristoffer and I decided to make a little optimisation with the way annotations are added to the MapView, since using UIKit was not an option he wanted to pursue. When a region change delegate method is called, a TaskGroup is created using all CPU cores to filter annotations to be added or removed for the respective region. This helps a bit, lowering the count of annotation views being added when MapView is running in SwiftUI.
I’ve also filed a bugreport with Apple. OpenRadar.
The Takeaway: If you’re planning on writing an app using MapKit, make sure to understand your requirements and act accordingly. Packing a lot of annotations into a SwiftUI embedded MapView can cause performance issues.
Oh, and one more thing: You can find the code used for this experiment on my Github